
With a collective sigh and a rush of engineers to the keg, the latest release of Savanna 4.1 headed out the door. As with every new Savanna release, we’ve added even more features to make your analysis experience fun and effective.
There were numerous enhancements to a variety of features in this release, but we’ll focus on two of our major enhancements: taggable Occurrences and heatmap visualizations.
Occurrence: Dynamic Documents for Dynamic Data

In 4.1, Savanna’s Occurrence tool continues to allow analysts to create connected information networks by capturing detailed, problem-specific information about people, organizations, places and events within dynamic documents. For example, you might make a Person Occurrence to gather information about the current Portland Mayor, or a Place Occurrence for Portland City Hall.
Because data isn’t always easily defined or categorized, Occurrences now allow analysts to customize information beyond the basic data fields.
Here are two of our new key customization tools:
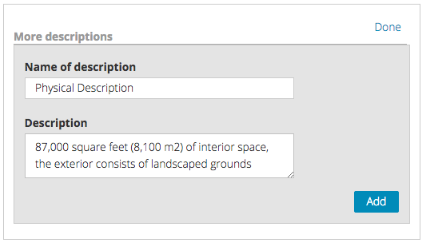
- Descriptions: Now you can add fine-grained detail to your Occurrences by entering new description names and types to capture and easily find specifics about your Occurrences. For example, you could add a physical description to your Portland City Hall Occurrence and fill in information from a specific article or website.
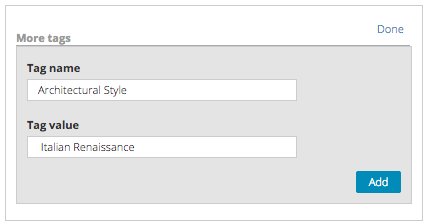
- Tags: Tags quickly reveal important keywords or phrases about an Occurrence. With the new tags fields, you can easily capture categories of an Occurrence that might not be available in a given template. For example, an analyst might make an Architectural Style tag name, and then fill in “Italian Renaissance” as the associated style.
These customizable options allow you to make the most of your data, giving you the ability to capture hard-to-define information and build interconnected networks for holistic analysis.
Map: Introducing a Hot New Feature (pun entirely intended)
Maps are everywhere, and digital maps are as commonly used today as atlases were in the 90’s (an atlas, if you remember, is a map depicted on paper). It’s important then that a map does more than show you how to get from point A to point B. Savanna’s Map tool geospatially visualizes data from any integrated or constructed standard open geospatial formats, with content filtering and visibility settings that allow you to quickly view the most relevant information.
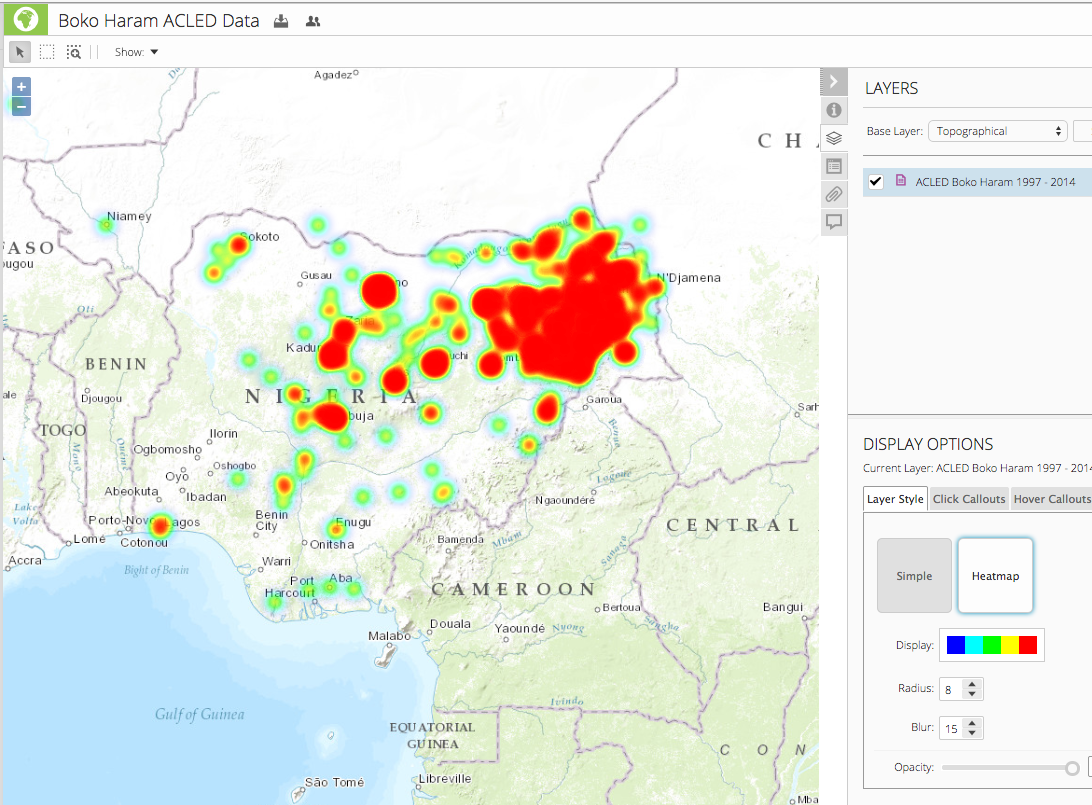 4.1’s heatmap enhancement allows you to capture and view trends in specific Map regions, giving you a bird’s eye view of your data that is customizable by radius, display color and opacity.
You can keep up with upcoming releases and new features here on our blog and in the meantime keep yourself entertained by watching Savanna in action on our YouTube page at http://www.youtube.com/ThetusCorp. Until next time.
Curious? Let's set up a free trial.
Try Savanna