It seems like only yesterday that we released Savanna 4.1, and here we are with a new release and exciting news for you. Savanna 4.2 adds many new features and enhancements, giving you comprehensive, easy-to-use tools to make your analysis experience intuitive, fun and fast.
While there were a variety of added features and enhancements, we will focus on three key developments: integration with IBM Analyst’s Notebook, enhanced Dashboard and temporal Map filters.
IBM Analyst’s Notebook integration
The integration of Analyst’s Notebook’s data analysis capabilities and Savanna’s dynamic concept modeling tools offers a holistic suite of tools catering to all areas of investigation.
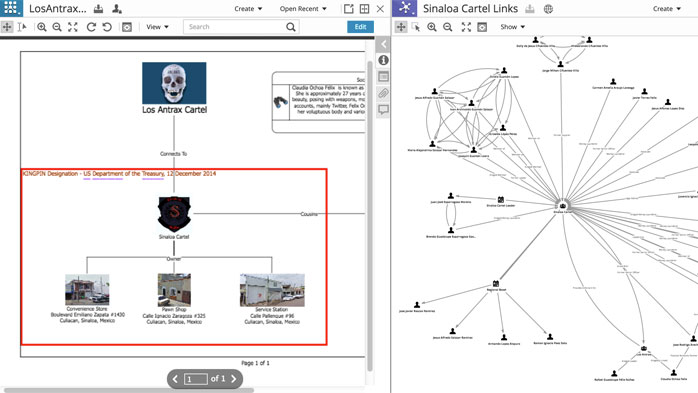
4.2’s integration with Analyst’s Notebook enables analysts to work seamlessly with Analyst’s Notebook Charts (ANB Charts) within the Savanna environment. After compiling data in Analyst’s Notebook, you can easily upload, search and view ANB Charts in Savanna, with all data indexed to allow Savanna’s Search tool to pull key terms from within a Chart for quick discovery and analysis.
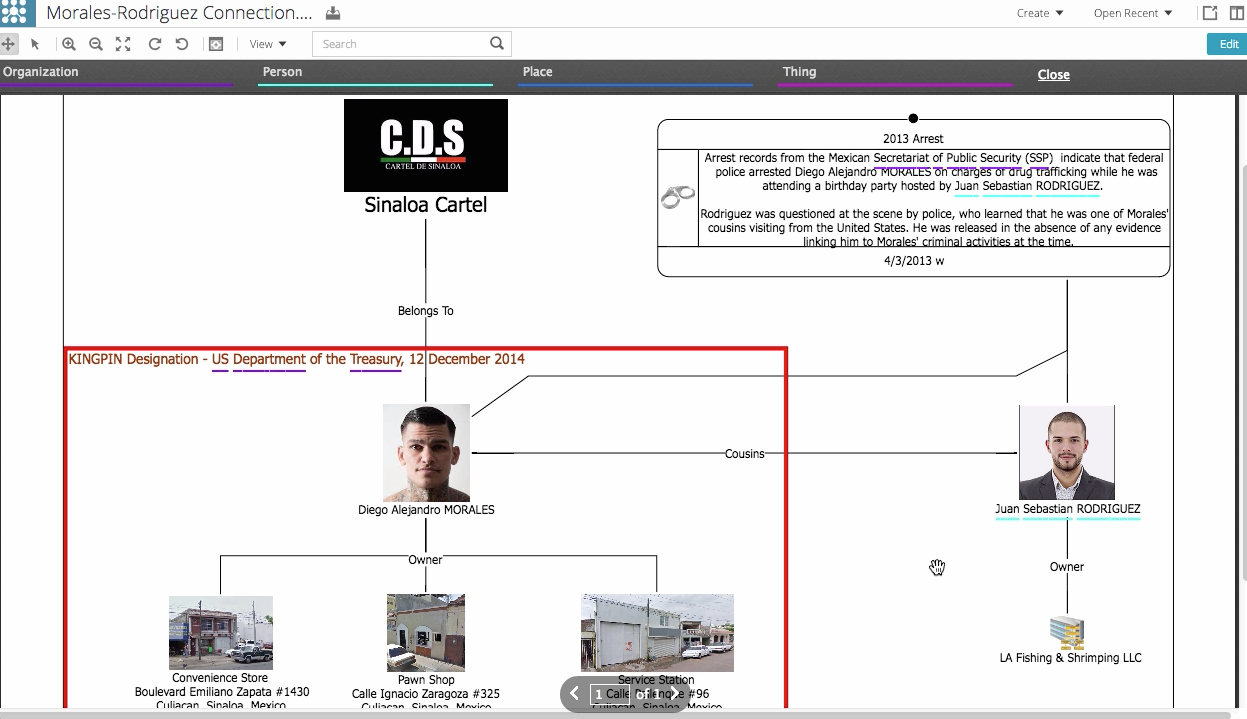 For example, you might be investigating cartel movements in Mexico and have a Chart file showing connections between numerous cartel members. After uploading the Chart to Savanna, you can Search, view and interact with the Chart. For instance, you might want to zoom in on key relationships between cartel members and take a screenshot to be used later in your analysis.
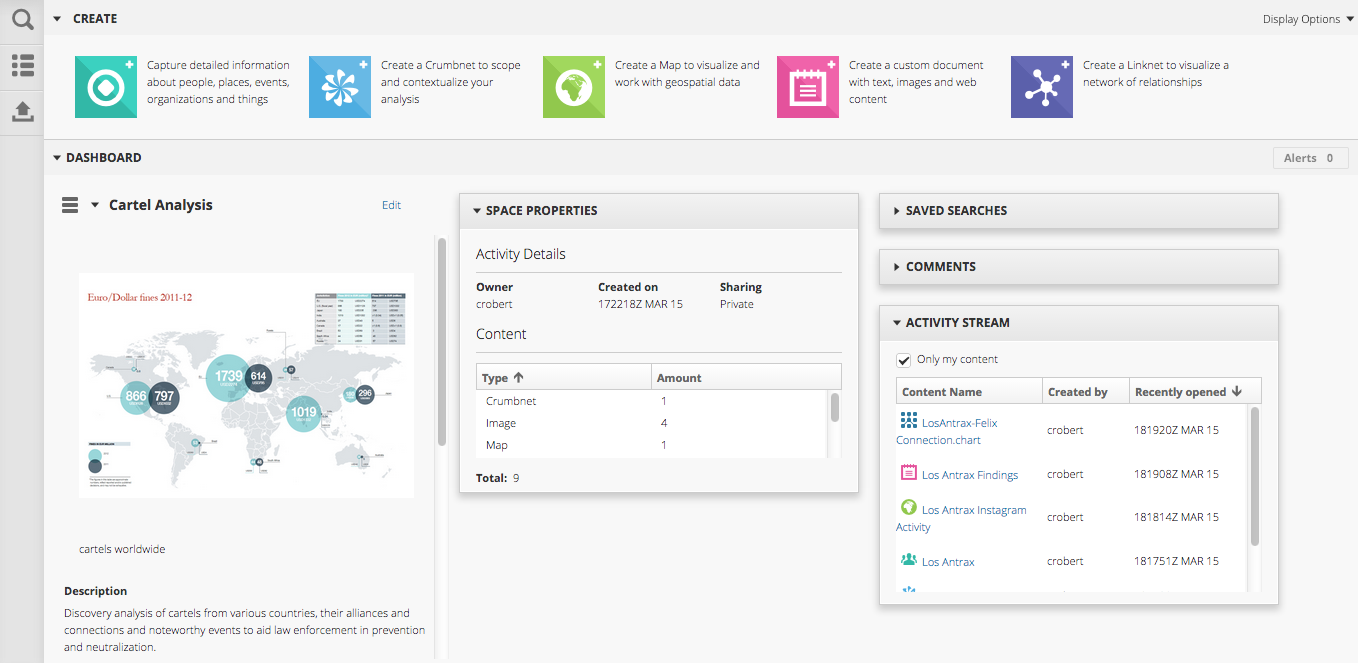
Dashboards: Customizable, Collaborative and Really Cool
The new Dashboard feature offers customizable, problem-specific hubs from which to launch your analysis workflow.
Analysts have long used Savanna to create problem areas (Spaces) where they can house and organize the information that they have collected and created. For example, an analyst might create a Space to house content and findings related to their analysis work about Mexican cartel movements.
Now, Dashboards act as the home page of each Space, giving you easy access to important information and providing alerts for recent activities, uploads, and models created within a Space. For example, a fellow team member may have uploaded an ANB Chart related to your current analysis. The Dashboard provides an alert to help you stay on top of the most current information available.
Dashboards also allow you to easily customize the layout and details of a Space, giving you the ability to view intelligence based on priority and preference to reduce redundancies and increase production.
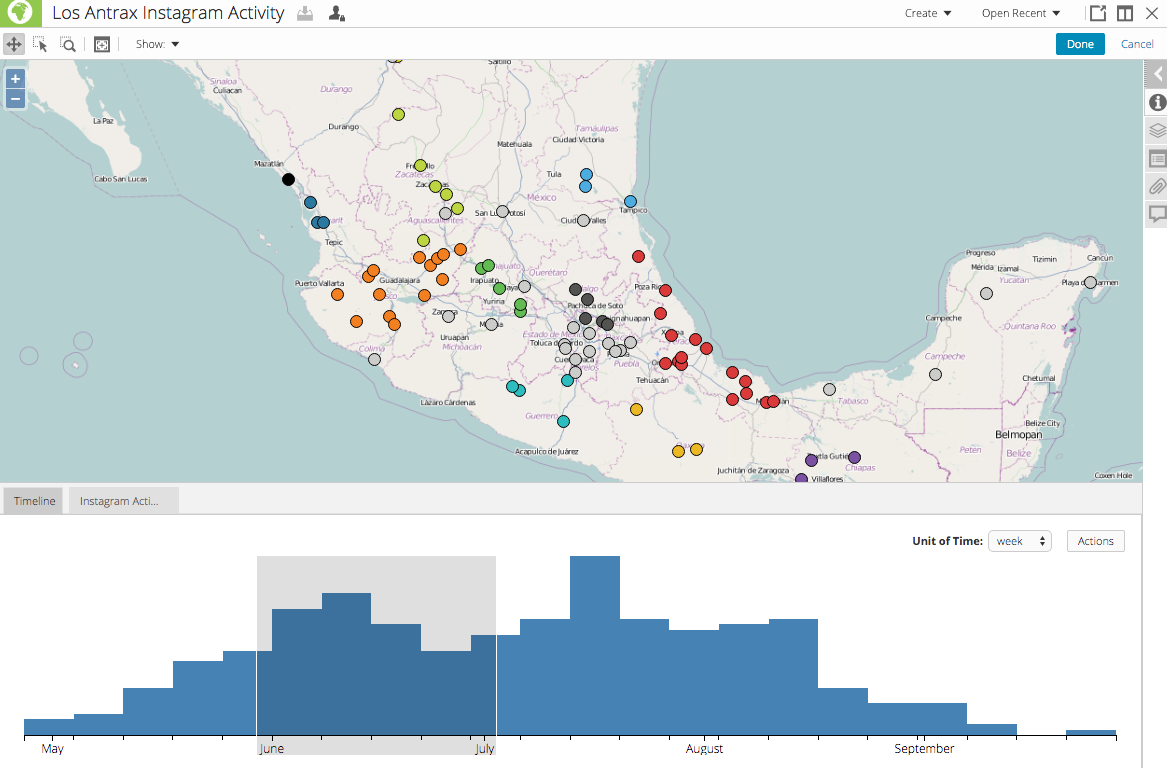
 Temporal Filters for Timely Information
With Map’s new temporal filter, you can quickly filter data to reveal date and location patterns at a glance. Simply drag the filter over a specific period of time to view data points on Map relevant only to the selected period.
The temporal filter also helps you view data as part of a larger historical whole, making it easy to discover trends that reveal themselves over time in a geospatial context.
 To keep up with upcoming releases and new features, follow our blog. In the meantime, you can keep yourself entertained by watching Savanna in action on our YouTube page at www.youtube.com/ThetusCorp. Until next time.
Curious? Let's set up a free trial.
Try Savanna